Showing posts with label Report Studio. Show all posts

2/13/2015

Cognos 10 Report Studio: Add more series to a chart

How to add more series to a chart? This is something I didn't remember and couldn't find right away, therefore I share it here.

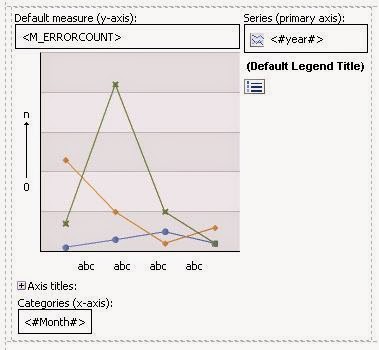
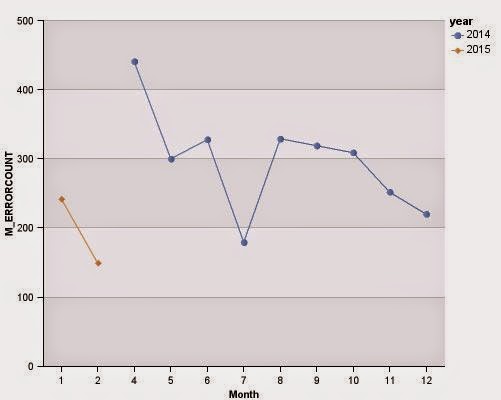
In this example I have combination line chart and some dummy data (pics 1, 2 & 3). I want to compare number of errors (m_errorcount) in different years and months to the target line.
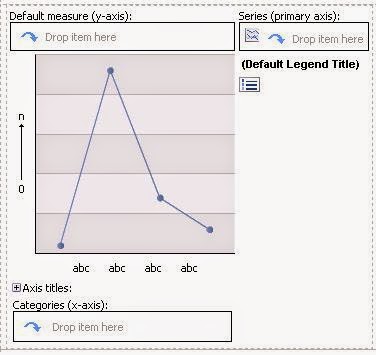
Pic. 1. Combination chart.

Pic. 2. Measure, categories and series added.
Pic. 3. Chart with data.


Generally there is only one series box where to drop item. I need to add another for target line data item. (See pink spots in the next pictures.)

[1] Click combination chart object and go to Properties > General. In a Combination line click three dots to see options.
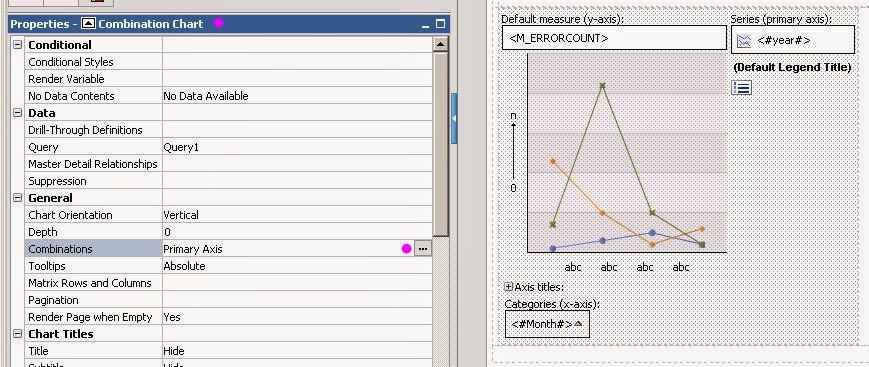
Pic4. Combination chart properties.


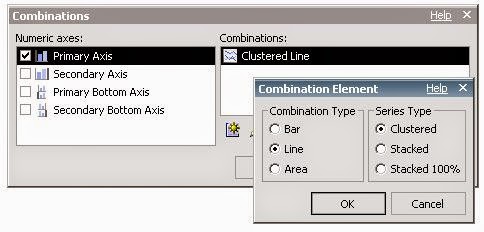
[2] Click Add-icon and choose type of element you want to add.
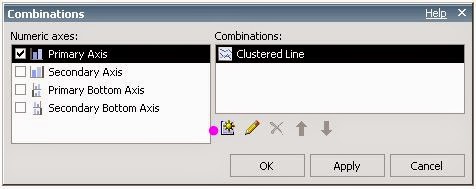
Pic. 5. Combinations options, add new.

Pic. 6. Types of combination element.
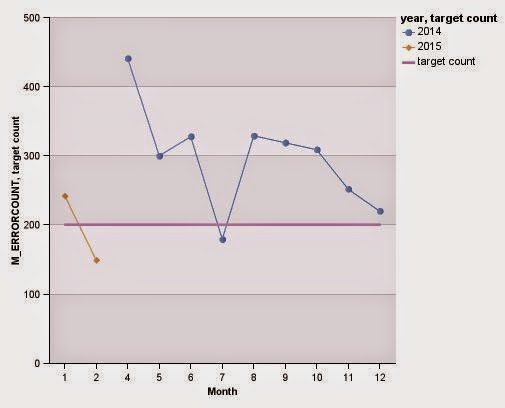
[3] After couple Ok clicks, you have another element in the series box where you can add second data item (Pic.7). Last picture (Pic. 8) shows result of the example chart.
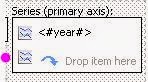
Pic. 7. Additional series.
Pic. 8. Result.

1/12/2012

Column headers differ in IE6 and IE8

I have an example how cognos report studio column (or row) headers appear in different versions of Internet Explorer and one way to make them look the same.

In these crosstab column headers text is in the multiple lines and background colour is purple. Looking the report in IE8 headers look fine but in IE6 top is gray [pic.1].

pic. 1

12/19/2011

Cognos 10: background image gives errors in the excel output

I had a this kind of case where I got an error when I tried to see the Report Studio report in Excel format. Reason for the error was that I had a background image in the report page. The image was JPEG and size is 1100x800 px. I decided to remove the image from the report.

Because I don't know how Excel handles images I'm still intrested to make tests where I use smaller image and/or GIF format.

11/02/2011

Cognos 10 Report Studio: Every second axis label missing

I made a simple vertical bar chart that I changed it to horizontal so that axis labels would be easier to read. Some of the labels were quite long and I had manually set break after 200 characters. That way whole label would be shown. But changing chart to horizontal, I lost every second axis label!

I read cognos help troubleshoot about labels but it wasn't so clear what I need to do with my report. I share my solution here if somebody has same problems with the labels. Again, texts in the pictures are in Finnish but I wrote instructions also in English.

[1] Go to axis labels properties and set options so that you don't allow skipping but either rotation or stagger is allowed. I chose to allow stagger:
Allow 45 Degree Rotation / Salli 45 asteen kierto --> No / Ei
Allow 90 Degree Rotation / Salli 90 asteen kierto --> No / Ei
Allow Stagger / Salli porrastus --> Yes / Kyllä
Allow Skip / Salli ohitus --> No / Ei


Axis properties - labels options


In my case this wasn't enough because I had set size to the chart and there wasn't enough space for the labels. First I tested it so that I took away all the chart size settings but it didn't help. (I didn't make any changes to the report page settings.) But I find the solution:

[2] If the first step didn't help yet, set the size of the chart big enough for the labels. I needed to set chart height to 600px and after that all the labels appeared.

Size and overflow / Koko ja ylivuoto

10/15/2011

Cognos 10 Report Studio - Adding secondary value axis to the chart

This example shows, how to add secondary value axis to the chart in C10 Report Studio. For example in this bar chart 'revenue' and 'profit margin %' measures can't use same axis (Pic.1.)


Pic.1

10/06/2011

Cognos 10 Report Studio - Format tooltip values

I show tooltip in a chart but measure value is too precise, like 1,629387. I want to show only one decimal. So, here are steps how to modify that tooltip value:


[ 1 ] On the chart Series / Sarja box, click measure text
[ 2 ] Go to  Properties - Chart Node Member / Ominaisuudet - Kaavion solmujäsen
[ 3 ] Click ellipsis (...) in the Data Format / Tietomuoto section to open properties and modify format of the measure as you like.

9/27/2011

Cognos 10 Report Studio - Rotate x-axis labels (legacy charts)

I made a report with a couple of charts in it, but the x-axis labels of the chart puzzled me. At first I couldn't find where I can modify the x-axis labels to be in a 90 degrees angle in all of those charts. Some of the charts had labels rotated 45 degrees, some 90 degrees and some of the labels were just horizontal. Now that I have solved it I want to share it :) . I add terms used in Finnish language Report Studio 'cause I think those translations used in it are often strange.

[ 1 ] Click category axis / luokan akseli in the chart
[ 2 ] In the properties list under General / Yleinen modify Label control / Nimen ohjausobjekti property from Default / Oletus àAutomatic / Automaattinen

Voilà! All the rotation properties are shown and you are able to set label rotation, eg. allow 90 degrees rotation.

NOTE: this applies to legacy charts.

6/24/2011

Cognos Report Studio and prevent page breaks in HTML report

I made reports in IBM Cognos Report Studio, version was 10 but it has only slight changes compared to version 8. (If you are new with Cognos you might wonder if I have typed number wrong but I haven't because previous version was 8.) Software was in Finnish and that makes it sometimes more difficult to find the right settings for objects's properties because translations can be so weird sometimes and use terms wrong. I wrote these instructions here because for me these settings weren't logical.. :) This page break example picture has Finnish texts.

Desired report layout had crosstab first and after that a couple of graphs and these all had to be in one HTML-page without page breaks.

At first I set rows per page number for the crosstab big enough to prevent page break then I checked that all possible properties which could affect to page breaks.

[ 1 ] Go to File / Tiedosto and in the Report Properties / Raportin ominaisuudet menu set ”Page break by data container for interactive HTML” / ”Tietosäilön sivunvaihto vuorovaikutteiselle HTML:lle” à Yes (default setting is No)
[ 2 ] Deselect ”Paginate saved HTML output” / ”Sivuta tallennetut HTML-tulokset” --> OK.

Report Properties

* Here is updated picture of the properties in English. (Report Studio version is 10.2.2). Instructions above still apply :) (pink spots in the pic)