2/13/2015

Cognos 10 Report Studio: Add more series to a chart

How to add more series to a chart? This is something I didn't remember and couldn't find right away, therefore I share it here.

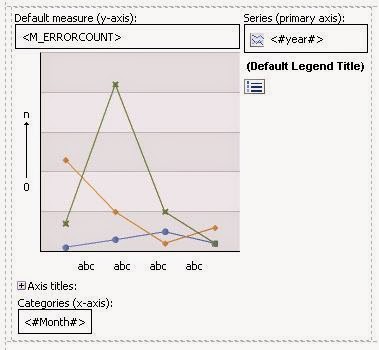
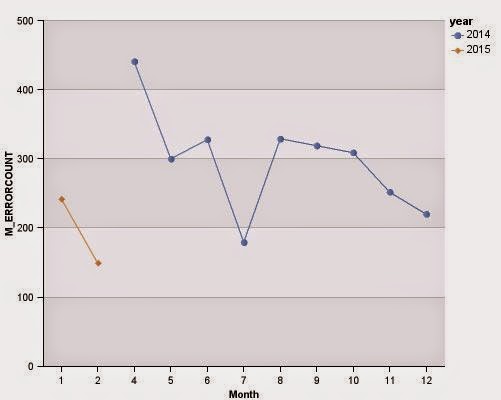
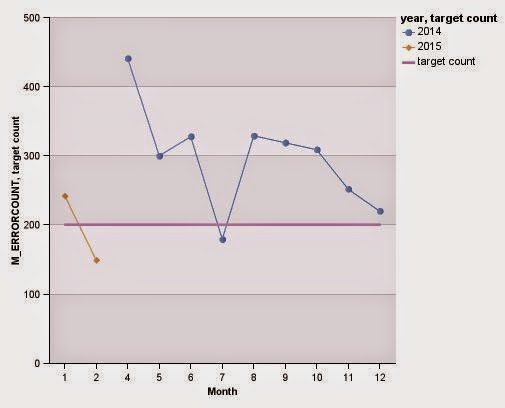
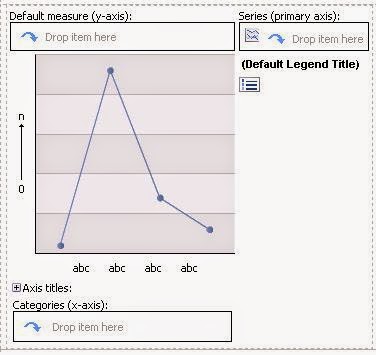
In this example I have combination line chart and some dummy data (pics 1, 2 & 3). I want to compare number of errors (m_errorcount) in different years and months to the target line.
Pic. 1. Combination chart.

Pic. 2. Measure, categories and series added.
Pic. 3. Chart with data.


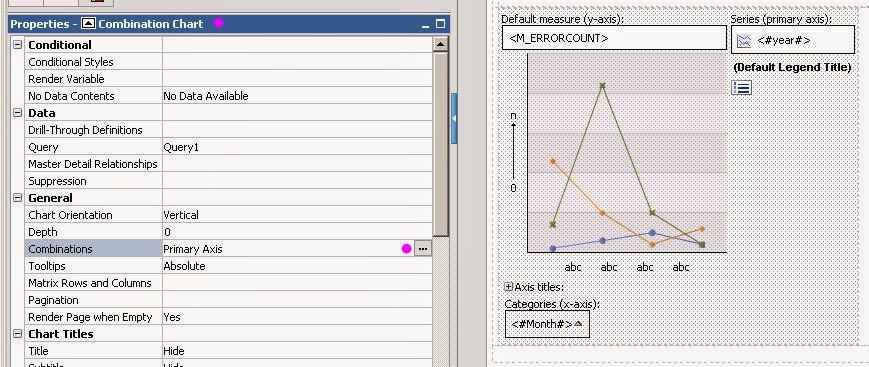
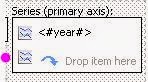
Generally there is only one series box where to drop item. I need to add another for target line data item. (See pink spots in the next pictures.)

[1] Click combination chart object and go to Properties > General. In a Combination line click three dots to see options.
Pic4. Combination chart properties.


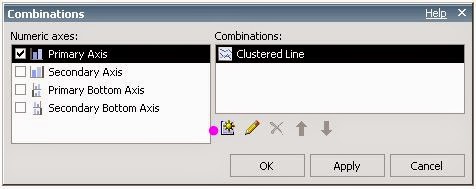
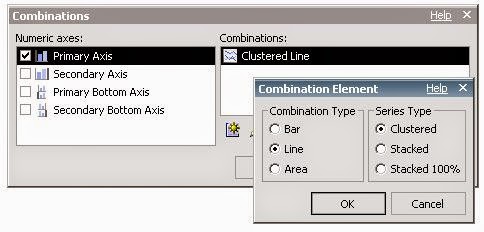
[2] Click Add-icon and choose type of element you want to add.
Pic. 5. Combinations options, add new.

Pic. 6. Types of combination element.
[3] After couple Ok clicks, you have another element in the series box where you can add second data item (Pic.7). Last picture (Pic. 8) shows result of the example chart.
Pic. 7. Additional series.
Pic. 8. Result.

4/14/2014

How to set up Oracle drives for Excel PowerPivot

My colleague tried to find simple instructions how to set up Oracle drivers in case for Excel PowerPivot but there wasn’t any that wouldn’t miss some critical points. So here’s the simple instruction on how to do it.

1.      Check the version of the Excel (or any other software you wish to use to browse the Oracle database), is it 32-bit or 64-bit?

2.      Load Oracle Data Access Components –package (ODAC) based on bits of the target software:

a.      32-bit version:
http://www.oracle.com/technetwork/database/windows/downloads/utilsoft-087491.html
        
b.      64-bit version:
http://www.oracle.com/technetwork/database/windows/downloads/index-090165.html

Download the ODAC XCopy version. The newest release is on the top.

3.      Unzip the package to your computer on some easy-to-access folder (e.g. c:\mytempfolder)

4.      Start command prompt (cmd.exe) as an administrator, go to your chosen folder.

5.      Look up the install command from the README.html file and run it in the command prompt (e.g. install all c:\oracle odac)
  • Don’t use any special characters in a name of the installation folder (which is c:\oracle in the example above)
  • Installing can take some time and you can see that it’s done when you can write again to the command prompt window. Yes, that's right, there's no other indication.
  • Installation has succeeded if the set up folder is created and have stuff in it (c:\oracle if you decided to use the example folder)
6.      Open Control Panel -> System -> Advanced System Settings: Environment Variables.
  • Add your set up folder (e.g c:\oracle) and both bin and network\admin folders  to the end of PATH-variable. (As default it would be ;c:\oracle;c:\oracle\bin;c:\oracle\network\admin;)
7.      Restart the computer

8.      Create tnsnames.ora file to the network\admin –folder in the setup folder. Add TNS entries to that file.

9.      Start Excel and PowerPivot, choose Oracle database source and additional setting: Oracle Data Provider for .Net. Fill up connection details and test connection.
  •  All the other providers seem work after using that provider if they weren’t working before.
  • You might get some ”missing DLL-file” notifications while setting up connection for the first time, but those are not damaging and next time you won’t see them anymore.

6/02/2012

MS SSRS: Jump to the Report Manager´s folder from a report

Case 1: I want to have link text “Go to Documents” in my report and clicking it takes me to ”Documents” folder in the Report Manager (ReportServer1).
> I add a Text Box to the report and type "Go to Documents" to it. Then I open the text box properties > Action. I choose "Go to URL" and click fx-button. See pic. below. 

I type the target folder URL to the expression box:

=”http://ReportServer1/Reports/Pages/Folder.aspx?ItemPath=%2fDocuments&ViewMode=List”                                

And it works.

Case 2: I want to have link text in my report and clicking it takes me to ”Documents” folder in the Report Manager (Report Server1). I can’t have Report Server name in the link because same report and it’s link has to work in several different report servers.
> There's a Built-in fields collection the Globals in the Reporting Services and one of the variables is ReportServerUrl. It returns the URL of the report server on which the report is being run. I use that:
=Globals!ReportServerUrl + "/Reports/Pages/Folder.aspx?ItemPath=%2fDocuments&ViewMode=List"                                      
As a result, it jumps to Report Server database directory:

And when I look at the address:
http://ReportServer1/ReportServer/Reports/Pages/Folder.aspx?ItemPath=%2fDocuments&ViewMode=List
I see ReportServer in the path because ReportServerUrl variable returns “http://servername/ReportServer”.

> So I have to revise this expression to have right path. Let’s take off that part using REPLACE function:

=Replace(Globals!ReportServerUrl + "/Reports/Pages/Folder.aspx?ItemPath=%2fDocuments&ViewMode=List", "ReportServer", "")

And now the link text works as I wanted.
3/04/2012

MS SSRS: Multivalue report parameter and "Select All" default value

For example report user is prompted to select one or more employees from a drop-down list to filter the report data. The "Select All" check box is automatically the first choice in the list and easy to choose but when report user wants to make the subscription of that report "Select All" is not included and she needs to go through clicking the whole list. 
This is my solution to handle multivalue report parameter filter with ´Select All' default value:

1. Make dataset query that retrieves all the employees.
2. Add report parameter, choose Allow multiple values option  and get Available values from "employee"-dataset.
3. Add filter to the dataset that retrieves the report: "employee IN [@employee]" (data type Text).
- - Now you have a multivalue parameter filter ready for the report. --
4. Set default values for the parameter using same employee dataset.
- - Now all employees are checked in the report prompt by default and subscription is also easier to do. - -

1/12/2012

Column headers differ in IE6 and IE8

I have an example how cognos report studio column (or row) headers appear in different versions of Internet Explorer and one way to make them look the same.

In these crosstab column headers text is in the multiple lines and background colour is purple. Looking the report in IE8 headers look fine but in IE6 top is gray [pic.1].

pic. 1

12/19/2011

Cognos 10: background image gives errors in the excel output

I had a this kind of case where I got an error when I tried to see the Report Studio report in Excel format. Reason for the error was that I had a background image in the report page. The image was JPEG and size is 1100x800 px. I decided to remove the image from the report.

Because I don't know how Excel handles images I'm still intrested to make tests where I use smaller image and/or GIF format.

11/02/2011

Cognos 10 Report Studio: Every second axis label missing

I made a simple vertical bar chart that I changed it to horizontal so that axis labels would be easier to read. Some of the labels were quite long and I had manually set break after 200 characters. That way whole label would be shown. But changing chart to horizontal, I lost every second axis label!

I read cognos help troubleshoot about labels but it wasn't so clear what I need to do with my report. I share my solution here if somebody has same problems with the labels. Again, texts in the pictures are in Finnish but I wrote instructions also in English.

[1] Go to axis labels properties and set options so that you don't allow skipping but either rotation or stagger is allowed. I chose to allow stagger:
Allow 45 Degree Rotation / Salli 45 asteen kierto --> No / Ei
Allow 90 Degree Rotation / Salli 90 asteen kierto --> No / Ei
Allow Stagger / Salli porrastus --> Yes / Kyllä
Allow Skip / Salli ohitus --> No / Ei


Axis properties - labels options


In my case this wasn't enough because I had set size to the chart and there wasn't enough space for the labels. First I tested it so that I took away all the chart size settings but it didn't help. (I didn't make any changes to the report page settings.) But I find the solution:

[2] If the first step didn't help yet, set the size of the chart big enough for the labels. I needed to set chart height to 600px and after that all the labels appeared.

Size and overflow / Koko ja ylivuoto

10/15/2011

Cognos 10 Report Studio - Adding secondary value axis to the chart

This example shows, how to add secondary value axis to the chart in C10 Report Studio. For example in this bar chart 'revenue' and 'profit margin %' measures can't use same axis (Pic.1.)


Pic.1

10/09/2011

CASE statement giving error in SSRS query designer

This is someting "back to basics" stuff.. :)

In SSRS query designer I needed write CASE statement like this:

        (CASE WHEN (tf_table.applicationtype = 1)  THEN ('first') 
         ELSE (tf_table.applicationtype) ) AS application

.....But I got error message:

10/06/2011

Cognos 10 Report Studio - Format tooltip values

I show tooltip in a chart but measure value is too precise, like 1,629387. I want to show only one decimal. So, here are steps how to modify that tooltip value:


[ 1 ] On the chart Series / Sarja box, click measure text
[ 2 ] Go to  Properties - Chart Node Member / Ominaisuudet - Kaavion solmujäsen
[ 3 ] Click ellipsis (...) in the Data Format / Tietomuoto section to open properties and modify format of the measure as you like.

9/27/2011

Cognos 10 Report Studio - Rotate x-axis labels (legacy charts)

I made a report with a couple of charts in it, but the x-axis labels of the chart puzzled me. At first I couldn't find where I can modify the x-axis labels to be in a 90 degrees angle in all of those charts. Some of the charts had labels rotated 45 degrees, some 90 degrees and some of the labels were just horizontal. Now that I have solved it I want to share it :) . I add terms used in Finnish language Report Studio 'cause I think those translations used in it are often strange.

[ 1 ] Click category axis / luokan akseli in the chart
[ 2 ] In the properties list under General / Yleinen modify Label control / Nimen ohjausobjekti property from Default / Oletus àAutomatic / Automaattinen

Voilà! All the rotation properties are shown and you are able to set label rotation, eg. allow 90 degrees rotation.

NOTE: this applies to legacy charts.

9/10/2011

Blog statistics

Precisely eleven months ago I sent my first posting here. I'm happy that I've got many readers even though I haven't been very active blogger. I want to share my blog statistics.

TOP 3 Topics
  1. Cognos Report Studio and prevent page breaks in HTML report
  2. Creating and copying custom palette
  3. Errors while loading the designer - fixed in code view
 
TOP 10 Countries
  1. Finland
  2. United States
  3. Germany
  4. Great Britain
  5. Australia
  6. India
  7. Singapore
  8. Russia
  9. Bosnia and Herzegovina
  10. Canada

Do U Love Excel-reports?

How would it sound if a manager of an organisation wanted a dashboard report, that would show what kind of impact it had, if he used less time for management and more for customer meetings?

When opening the report, different scenarios would be played in 3D video and James McCaffrey (voice actor of MaxPayne video game) would be the narrator. For showing the report in the board meeting, it would have elements based on the organisations graphic instructions and in addition personal themes that were loaded from an online store.

My imagination is not the wildest, but could that description above be something like what the Generation Y managers would want? Past years Generarion Y in a workplace, being led and being leaders, has been a topic of discussion. How does this generation, who was born in the internet-era and to whom computers are a given, differ from the previous generations? I'm interested in what this brings to my work in BI-reporting area or will it bring anything at all?

In differend sources the Generation Y is defined to be born between 1977-1990, 1980-1995 or 1980-2000 and in a way I myself belong to that generation, but when you’re used to seeing old-fashioned reports, it is easy to get stuck with them. The most important wish for a customer may be, that a report can be viewed in Excel-format and the numbers can later be tweaked by them. They don’t necessarily care at all how ugly the report looks and in the worst case they may wish to input as much as 30 prompts before they run the report!

Generation Y is described, for example, so that user experience is important and delays are irritating for them. I can believe, that Generation Y demands much more from a report, than “just show the right figures”!

6/24/2011

Cognos Report Studio and prevent page breaks in HTML report

I made reports in IBM Cognos Report Studio, version was 10 but it has only slight changes compared to version 8. (If you are new with Cognos you might wonder if I have typed number wrong but I haven't because previous version was 8.) Software was in Finnish and that makes it sometimes more difficult to find the right settings for objects's properties because translations can be so weird sometimes and use terms wrong. I wrote these instructions here because for me these settings weren't logical.. :) This page break example picture has Finnish texts.

Desired report layout had crosstab first and after that a couple of graphs and these all had to be in one HTML-page without page breaks.

At first I set rows per page number for the crosstab big enough to prevent page break then I checked that all possible properties which could affect to page breaks.

[ 1 ] Go to File / Tiedosto and in the Report Properties / Raportin ominaisuudet menu set ”Page break by data container for interactive HTML” / ”Tietosäilön sivunvaihto vuorovaikutteiselle HTML:lle” à Yes (default setting is No)
[ 2 ] Deselect ”Paginate saved HTML output” / ”Sivuta tallennetut HTML-tulokset” --> OK.

Report Properties

* Here is updated picture of the properties in English. (Report Studio version is 10.2.2). Instructions above still apply :) (pink spots in the pic)

6/01/2011

Bottoms up! Finally simple bottomN report is working

I had difficulties to create simple Top N or Bottom N report in SSRS but finally it's working :) ! Here's the example how use bottom N filter in a tablix report. In this case I wanted to have list of the oldest jobs from the database table and the prompt where user can choose how many records are shown in the list.

[ 1 ] I made Report Parameter p_bottomN that is Visible to user.
[ 2 ] In its properties Available Values tab I specified values 5, 10 and 20 for user to choices. Label and value were both same. In Default Values tab I added value 5.
[ 3 ] Then in report's Dataset Properties and Filters tab I added filter:
  • Expression [JobDate]
  • Operator Bottom N
  • Value [@p_bottomN]

Report looked fine when previewing it an I even didn't need to pre-order my data in dataset query. But after I deployed the report to the report manager, publishing site - bottomN prompt wasn't visible and default record amount wasn't 5. This was because at first I had this parameter hidden and default value was 10. Problem was solved in report manager. I looked to report's properties and parameter tab where I needed to put this prompt visible and change the default value.


Report Manager - Parameter tab.

2/26/2011

Report Page Setup - Paper size

I use next setup for the reports that are displayed in HTML and PDF formats and need to be ready for printing.

Report Properties - Page Setup


Report Properties > Page Setup I have inches for units because I couldn't set size right with centimeters. When orientation is portrait then Width: 8,27in and Height: 11,69in. (For landscape - the other way round.)

Page margins are 0,5 inches so that it's easy to control report body width in relation to paper size. I have the ruler displayed in report designer and I set report body width to some what 7,2in (paper width 8,27in - margins 2*0,5in). Now report content won't exceed paper width and printing blank papers is avoided.

MS SSRS - Sorting chart axis labels

In the beginning I had difficulties to remember where to find sorting options for the chart axis labels. Clicking around chart area and checking properties got to my nerves but then I decided to write it down for the future and then I begin to remember. I thought this would be useful post to some others too. In this example I add sorting to x-axis "finished_month".

[ 1 ]   Click over x-axis labels so that x-axis category field is seen
[ 2 ]   Right-mouse click open  Category Group Properties and add sorting.
 
x-axis labels - sorting


Notice...
[ 3 ]   It doesn't show anything at Chart Member Properties: SortExpression box. You have to click it open to see the sorting options for that Chart Member.

10/31/2010

MS SSRS - Creating and copying custom palette

There are some preset palettes in Report Designer to use in charts. I did custom palettes because the variety of colours is not enough in preset palettes. I needed more than 10-13 different colours to the charts. I designed the custom palette using a colour pair system. In that system dark and light shade of same colour make one pair. That way bars in the chart or slices in the pie would be easier to recognize.

10/11/2010

Errors while loading the designer - fixed in code view

During these months when I have build reports with Reporting Services, I haven't got many error messages but here is one that I met today...

I got following error message when I tried to open report file in Reporting Services designer:

One or more errors encountered while loading the designer.--- The errors are listed below. --- Deserialization failed: The 'DataType' attribute is not declared. Line 4921, position 20.

I could open report file in code view by right-clicking report and choseing "view code". I scrolled to that part of the code which was metioned in error message; line 4921, position 20. Error was in prompt parametervalue command/rule: DataType= "Integer".
Line was: <Value DataType= "Integer">0</Value> 
I removed that text ' DataType="Integer" --> <Value>0</Value>

After this correction report could be open in design view.

10/09/2010

MS SSRS - Gradient colour to action button

I tried to find how to apply gradient colour to textbox item and after searching options from help and internet I found an answer from the social.msdn.microsoft.com forum site. There was told that gradient colour is possible only in chart and gauge report items.

Luckily there was suggestion to create chart and set it's backgroud, hide all the chart element so that only the gradient fill is seen. I tried that then.

I set BorderSkin (Skin Type) as Raised then it looked like more as buttons in the software what for this report was done. I also named this chart as BackButton. I put my button text to chart title, because I didn't know how to get my textitem over this chart.

I needed to fix appearance of my caption and also set docking properties so that it looked fine (1). DockOffset was set to 10 and Position as TopCenter.
1. Docking settings

Then I set Action for my button text to go back to main the report page.


There is still one thing I hadn't solved, how to hide that light gray line around the button.

Back button with gradient colours.