How to add more series to a chart? This is something I didn't remember and couldn't find right away, therefore I share it here.
In this example I have combination line chart and some dummy data (pics 1, 2 & 3). I want to compare number of errors (m_errorcount) in different years and months to the target line.
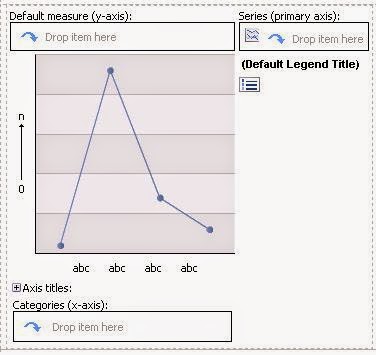 |
| Pic. 1. Combination chart. |
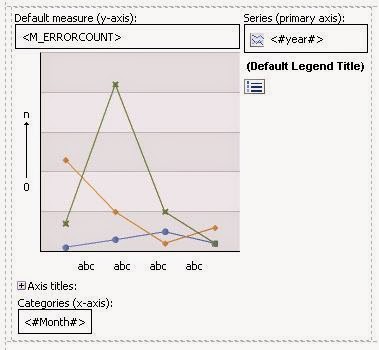 |
| Pic. 2. Measure, categories and series added. |
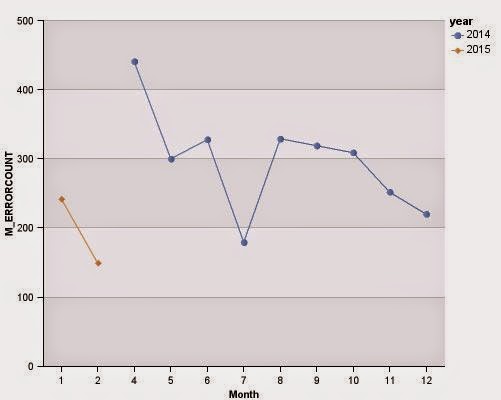 |
| Pic. 3. Chart with data. |
Generally there is only one series box where to drop item. I need to add another for target line data item. (See pink spots in the next pictures.)
[1] Click combination chart object and go to
Properties >
General. In a
Combination line click three dots to see options.
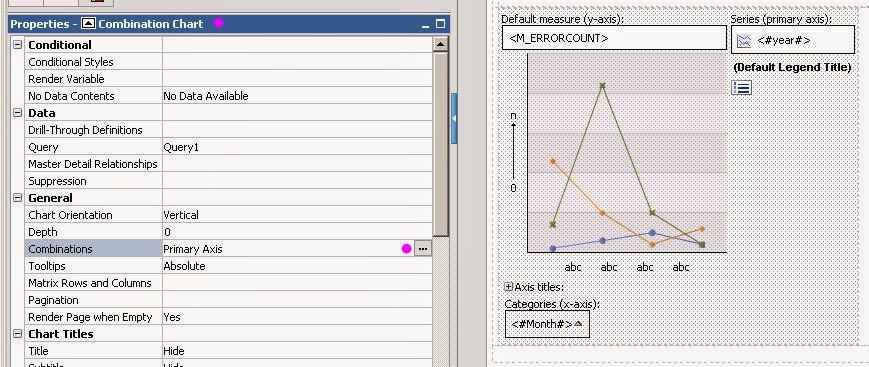 |
| Pic4. Combination chart properties. |
[2] Click
Add-icon and choose type of element you want to add.
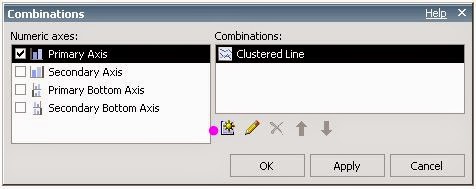 |
| Pic. 5. Combinations options, add new. |
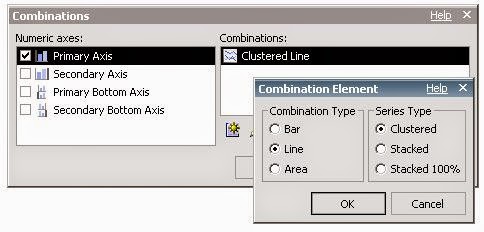 |
| Pic. 6. Types of combination element. |
[3] After couple Ok clicks, you have another element in the series box where you can add second data item (Pic.7). Last picture (Pic. 8) shows result of the example chart.
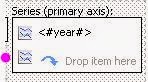 |
| Pic. 7. Additional series. |
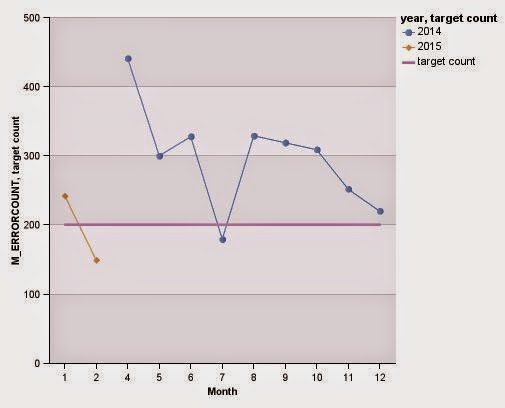 |
| Pic. 8. Result. |